Sally's Story
Sally has had T2DM for 12 years.
Her need to gradually increase meds over the years has happened.
When we met Sally was on metformin, gliclazide, GLP1 agonist injection.
HBA1C was 74.
The next therapeutic option was insulin.
We discussed root cause of type 2 diabetes. Sally had not heard of this before but it made sense and she now understood why her low fat foods and products from weight reducing brands may not have been effective. She started on our 6-week intervention course.
Weight has steadily come off, 7kgs lighter, 7cm off waist, Systolic BP is 30 points lower, diastolic is 20 points lower. But her sugars are stubbornly high. 9-12 mMol/l
When sally started our course she had one hypo of 3 when on gliclazide- so this was stopped. There are a slight increase in single figure glucose readings but not much.
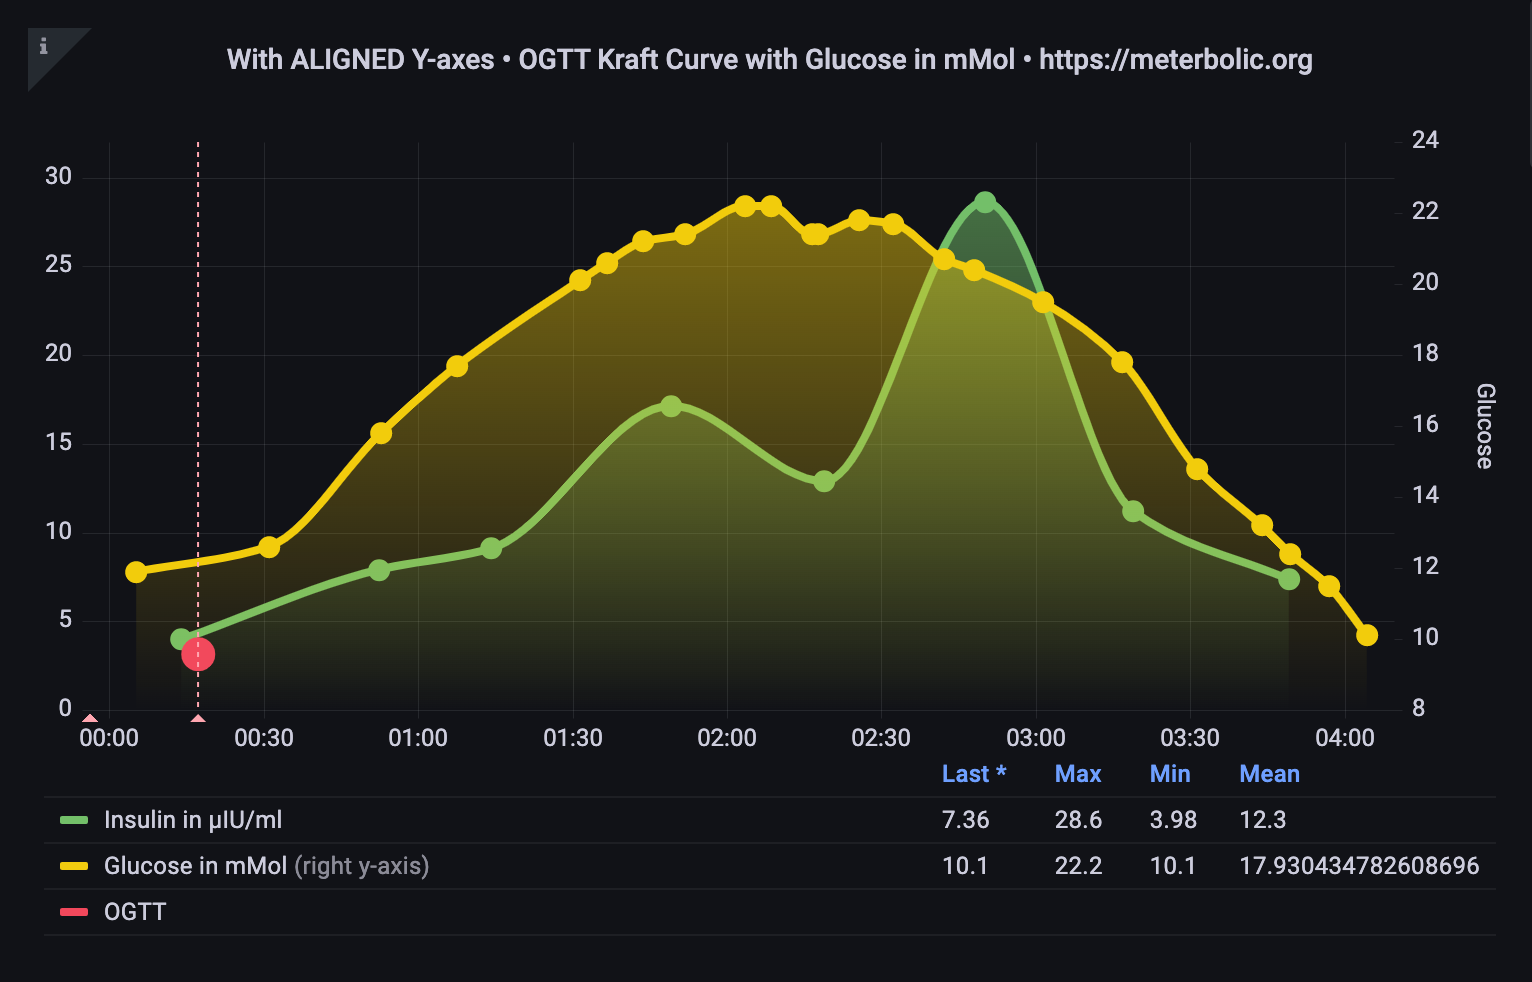
So with most metabolic markers improving, but her glucose stubbornly high we performed a Kraft curve to understand what is going on:
My feeling was could this be a LADA or another autoimmune response. Could it be a very tired pancreas suffocated with ectopic fat.
So we need to get GAD antibodies done. If these are normal, then be a bit more patient and as pancreas gets freed from ectopic fat it may function in a more insulin sensitive way. Sally looks like an insulin resistant individual. Our assay technology requires quantification of the length of the error bars to reassure us on the numbers that we are seeing.
Kraft from venous samples was getting numbers in the 100s for insulin resistance. Our numbers seem lower? Is there a difference between venous and capillary samples?
We need a table of “normal” and kraft ranges for capillary samples. Plus this shape of graph is not described in Kraft series? Why?
This experience is raising many good questions but improving our understanding of what is happening in the body.
Comments are as always welcome 🤗
Donal Collins


